From Fragmented to Unified: SaaS Reporting Dashboard Migration Guide

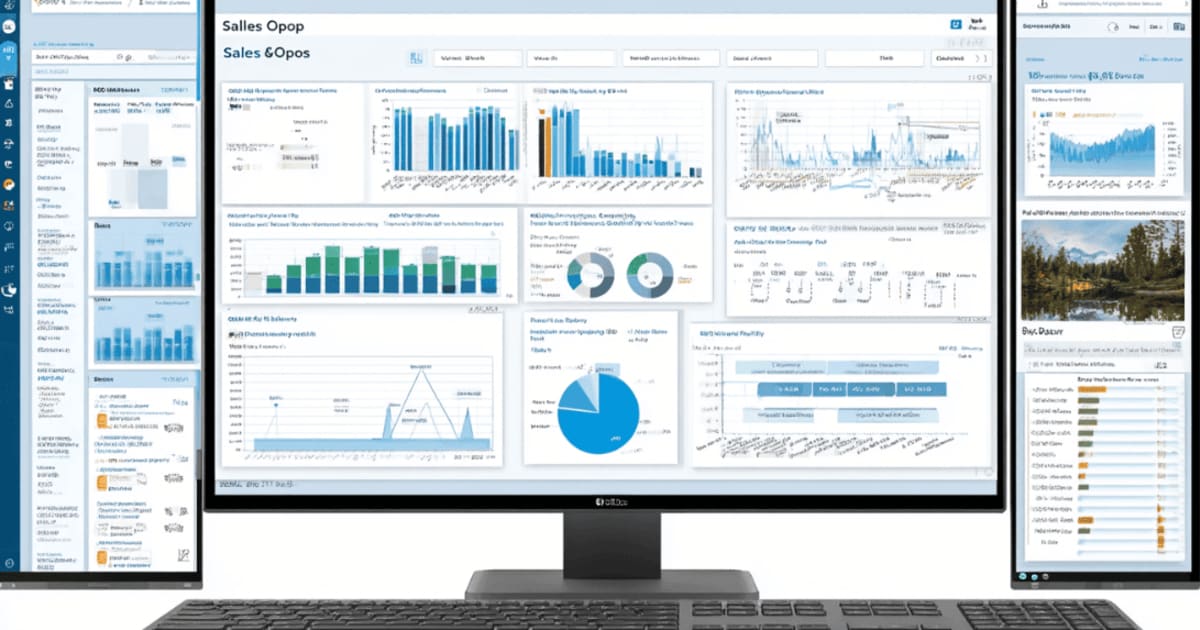
From Fragmented to Unified: SaaS Reporting Dashboard Migration Guide
If you're reading this, your unified reporting dashboard probably doesn't exist yet. You've got Metabase over here, a Salesforce dashboard over there, three Google Sheets that "should match" but don't, and a weekly Monday morning fire drill where someone asks, "Why don't these revenue numbers agree?"
How many hours did your team burn last week reconciling reports from different systems? How many decisions got delayed because nobody trusted the data? How much revenue slipped through the cracks while your analysts played data detective instead of actually analyzing data?
You're not alone. And the cost of staying fragmented is way higher than you think.
As we covered in our cross-system reporting guide, running analytical workloads on the same databases that serve your production traffic creates a performance bottleneck. But the reporting fragmentation problem goes deeper than database performance. It's an organizational problem disguised as a technical one.
Mid-market SaaS companies use an average of 335 SaaS applications (3). Each one generates its own reports. Its own dashboards. Its own version of "the truth."
The average team uses 73 SaaS apps, up 14% year over year (4). That means every department is building custom dashboards with different data sources, different metrics definitions, and zero coordination.
The result? Dashboard sprawl. One company accumulated 400+ dashboards without a single shared source of truth (7).
This guide breaks down the real cost of fragmented reporting, the stats you need to make the business case, 10 solution approaches with pricing, and the mistakes that kill most migration projects before they deliver a single insight.
The Real Cost of a Fragmented Reporting Dashboard vs. a Unified Reporting Dashboard
The numbers here are brutal.
Direct financial damage from data silos:
- Data silos cost organizations $12.9 million on average per year in poor data quality losses (2)(3)
- Data silos cost the global economy $3.1 trillion annually (20)(21)
- Data silos inflate operational costs by up to 30% (2)
- Data silos can cost businesses up to 30% of potential annual revenue through missed upselling, duplicated efforts, and delayed responses (15)
Per-employee SaaS spend:
- SaaS spend per employee reached $4,830 in 2025, up from $3,960 in 2024 (22)
- Per-system annual maintenance cost ranges from $30,000–$40,000 (19)
- 60–80% of IT budgets are consumed by maintenance of existing systems (19)
Think about that. Your organization is spending the majority of its IT budget keeping fragmented systems alive instead of building a unified reporting dashboard that actually drives data driven decisions.
For a mid-market SaaS company with 200 employees, that's nearly $1 million per year in SaaS spend alone, and most of it generates reports nobody trusts.
Unified Reporting Dashboard Adoption: Why Most Teams Still Don't Have One
Here's what makes this problem sticky.
Everyone knows dashboards are scattered. But consolidation keeps stalling.
- Companies average 106 SaaS apps in 2024, down from 112 in 2023, but the consolidation rate dropped from 14% to just 5% (1)
- Only 20–25% of employees actively use BI tools, flat for a decade (17)
- 29% of employees use analytics and BI tools on average, despite 87% of orgs reporting increased analytics users (18)
- Enterprise application sprawl averages 897 systems with only 28% integration (19)
- 40% of data managers say too many tools and data sources are a daily struggle (8)
So the tools keep multiplying, the dashboards keep fragmenting, and BI adoption stays stuck below 30%.
The problem isn't that people don't want a unified reporting dashboard. It's that the migration path feels impossible.
How Unified Dashboards Destroy Analyst Productivity Waste
Here's where the business case gets impossible to ignore.
Your analysts aren't analyzing data. They're hunting for it.
- Knowledge workers spend approximately 19% of their time searching for and consolidating information across systems (14), and the true cost of manual data consolidation at 100 employees runs to $42,000 or more per year.
- Analysts spend 30–60% of their time wrangling data before analysis (14)
- Data analysts spend 28% of time on data preparation, roughly 500 hours per year worth approximately $22,000 in salary per analyst (13)
- 63% of marketers' data-related time is spent on tasks that could be partially or fully automated (28)
- Data scientists spend approximately 80% of their time on data preparation and collection (29)
For a 10-person analytics team, that's $220,000 per year recoverable through a unified reporting dashboard with consistent data sources (13).
That's not a rounding error. That's a headcount you could redeploy to revenue-generating work, or a headcount you never need to hire in the first place.
Unified Reporting Dashboard Migration: The Risk Nobody Talks About
Migration projects fail at an alarming rate. This is the part most vendors skip in the sales pitch.
- 83% of data migration projects either fail or exceed budgets and timelines (5)(6)
- Up to 70% of data warehouse modernization projects fail or significantly exceed budget (23)
- Only 46% of data migration projects are delivered on time; only 36% stay within budget (24)
- Companies spend 40–60% more time in post-migration cleanup when they don't plan for analytics from the start (25)
- Organizations experience 20–30% productivity loss during transition periods (26)
- Migration inefficiencies cost enterprises 14% more than planned spending (27)
So the average company can expect to blow its budget, miss its timeline, and lose a quarter of team productivity during the switch.
That's not a reason to stay fragmented. That's a reason to plan the migration with complete visibility into what actually goes wrong.
Unified Reporting Dashboard ROI: The Business Case for Consolidation
The upside is just as dramatic as the downside.
- Organizations that carefully evaluate their data consolidation methods before migrating achieve 200–400% ROI over 3 years from consolidation with 30–70% performance improvements (19).
- The global embedded analytics market is valued at $67.24B in 2025, projected to reach $200.19B by 2033 at 14.65% CAGR (30)
- The data integration market is expected to grow from $17.58B (2025) to $33.24B by 2030 at 13.6% CAGR (31)
The market is moving toward unified dashboards for a reason. Companies that shorten decision cycles are twice as likely to achieve above-average growth compared to slower peers (12).
That's what a single platform with real-time access to all your data sources actually buys you: faster decisions, better results, and business growth that compounds.
10 Solution Approaches to Building a Unified Reporting Dashboard
Here's the part where most guides give you one answer. The truth is there are at least 10 legitimate approaches, and the right one depends on your team's maturity, budget, and reporting needs.
Unified Commercial BI Platform (Tableau, Looker, Power BI)
- Cost range: $50,000–$250,000 implementation; $15–$75/user/month ongoing (32)(33)
- Timeline: 6–20 weeks
- Best for: 100+ dashboard users with dedicated BI teams
- Watch out for: Per-user licensing that escalates fast at scale
Open-Source BI Stack (Metabase + Grafana)
- Cost range: $0 (self-hosted) to $50,000–$100,000/year fully loaded (34)
- Timeline: 2–12 weeks
- Best for: Engineering-led SaaS companies comfortable with SQL
- Watch out for: Requires internal DevOps for hosting and security
Cloud Data Warehouse + dbt + BI Layer
- Cost range: $3,000–$5,000 setup + $500–$2,000/month compute; dbt Cloud $100–$500/month (35)(36)
- Timeline: 8–16 weeks
- Best for: Data-mature teams ready to separate analytical workloads from production databases
- Watch out for: Higher total cost and unpredictable warehouse compute costs
Embedded Analytics Platform (Sisense, Luzmo, Domo)
- Cost range: $30,000–$150,000/year
- Timeline: 4–10 weeks
- Best for: SaaS companies wanting customer-facing analytics inside their product
- Watch out for: Cost scales with embedded usage volume
Custom-Built Dashboard (React/Python + PostgreSQL/MySQL Direct)
- Cost range: $50,000–$200,000 initial; $2,000–$10,000/month maintenance
- Timeline: 12–24 weeks
- Best for: Unique reporting requirements no off-the-shelf tool satisfies
- Watch out for: Highest engineering investment and ongoing maintenance burden
Integration Platform (iPaaS) + Centralized Reporting
- Cost range: $20,000–$80,000/year total (40)(41)
- Timeline: 4–12 weeks
- Best for: Companies with many SaaS data sources beyond just databases
- Watch out for: Compute and row-volume pricing can escalate quickly
BI Portal / Analytics Hub
- Cost range: $30,000–$100,000/year
- Timeline: 4–8 weeks
- Best for: Companies with multiple entrenched BI tools that can't be immediately consolidated
- Watch out for: Doesn't fix underlying metric inconsistencies
Semantic Layer (dbt Semantic Layer, Cube.dev, AtScale)
- Cost range: $10,000–$60,000/year (36)(44)
- Timeline: 6–12 weeks
- Best for: Companies where metric inconsistency across dashboards is the core pain
- Watch out for: Doesn't consolidate visual dashboards, only the numbers behind them
Cloud-Native Analytics (AWS QuickSight, Google Looker, Azure Fabric)
- Cost range: $15,000–$60,000/year for mid-market (45)
- Timeline: 4–10 weeks
- Best for: Companies heavily invested in a single cloud provider
- Watch out for: Vendor lock-in to a single cloud ecosystem
Reverse ETL + Operational Analytics (Hightouch, Census, Polytomic)
- Cost range: $10,000–$50,000/year (46)(47)
- Timeline: 2–6 weeks
- Best for: Teams that don't use dashboards; they need actionable insights pushed into Salesforce, HubSpot, or Slack
- Watch out for: Requires a well-modeled data warehouse as prerequisite
If your team spends 1–2 days per week on manual reporting, a CRM data scientist agent can connect your CRM and databases once, then deliver dashboards and reports on a schedule: no toggling between 5 systems, no stale data by Friday.
Unified Reporting Dashboard Mistakes That Cost Companies $$$
These are the mistakes that turn a 12-week migration into a 6-month money pit.
Migrating every dashboard 1:1 without rationalization
- Cost: $200,000–$500,000 in unnecessary project scope. Most organizations find 40–60% of existing dashboards are never actually used (8)(17).
- Fix: Audit usage first. Migrate the 15–25 critical dashboards. Retire the rest.
Skipping the semantic layer / metric definitions
- Cost: $150,000–$300,000/year in analyst time reconciling conflicting reports. Organizations report spending 17+ hours per week maintaining legacy metrics (19).
- Fix: Define core metrics in a semantic layer before building any custom dashboards.
Underestimating data quality issues in PostgreSQL/MySQL sources
- Cost: 40–60% more time in post-migration cleanup. Bad data costs the average organization $12.9 million annually (25)(6)(27).
- Fix: Profile and validate data before migration. Budget 20–30% additional project time for cleaning.
Choosing the tool before defining requirements
- Cost: $50,000–$250,000 on BI implementations that may need to be repeated. 83% of migration projects already exceed budgets (23)(5)(32).
- Fix: Review the four CRM database integration approaches before committing to a platform. Start with a requirements matrix covering data sources, user personas, access patterns, and budget.
Ignoring change management and user adoption
- Cost: 20–30% productivity loss during poorly managed transitions. BI adoption stays at 20–25% even in mature environments (26)(17).
- Fix: Assign a change management lead. Run parallel environments. Empower department-level dashboard champions.
Not separating analytical workloads from production databases
- Cost: Emergency remediation: read replicas ($500–$2,000/month), query optimization sprints ($10,000–$30,000), or full warehouse implementation ($50,000–$150,000) mid-project (35)(19).
- Fix: Plan for workload separation from day one. At minimum, use read replicas for BI queries.
Treating migration as a one-time project rather than an ongoing program
- Cost: Companies often find themselves migrating again within 12 months. The 200–400% three-year ROI never materializes because the consolidated state degrades (19)(42).
- Fix: Establish a reporting center of excellence. Run quarterly usage audits. Budget 10–15% of initial implementation cost annually for ongoing work.
Unified Reporting Dashboard FAQs
Q: How long does it take to migrate to a unified reporting dashboard? A: Timeline ranges from 2–24 weeks depending on approach. Open-source and cloud-native deployments take 2–10 weeks. Custom builds and full warehouse migrations take 12–24 weeks. Only 46% of migration projects are delivered on time (24).
Q: What does a unified reporting dashboard migration cost for mid-market SaaS? A: Total cost ranges from $15,000 to $250,000+ in the first year depending on approach. Open-source stacks start near $0 in licensing. Enterprise BI platforms run $50,000–$250,000 for implementation alone (32)(33)(34).
Q: Should I build or buy a unified reporting dashboard? A: Traditional BI vs. AI-powered solutions covers this tradeoff in full, but the short answer is buy unless your reporting needs are truly unique. Custom dashboards cost $50,000–$200,000 upfront plus $2,000–$10,000/month in maintenance. Teams building dashboards in-house drain resources that should go toward your core product.
Q: How many dashboards should survive migration? A: Most organizations find 40–60% of existing dashboards are never used (8)(17). Start by migrating the 15–25 dashboards that drive actual decisions. Retire the rest.
Q: What's the biggest risk in a unified reporting dashboard migration? A: 83% of data migration projects either fail or exceed budgets and timelines (5)(6). The top killers are skipping metric definitions, underestimating data quality issues, and ignoring change management.
Your reporting is either a competitive advantage or a tax on every decision your organization makes. Fragmented dashboards cost the average company $12.9 million per year in data quality losses alone. A unified reporting dashboard isn't a nice-to-have. It's the difference between making smarter decisions with confidence and flying blind with stale data.
Want help implementing a unified reporting dashboard? Get started here
Sources
(1) bettercloud.com (2) lumenalta.com / industry studies (3) gartner.com (4) productiv.com (5) gartner.com (via oracle.com) (6) experian.com (7) postgresql.org / industry analysis (8) emarketer.com (9) productiv.com (10) productiv.com (12) mckinsey.com (13) bluehillresearch.com (14) mckinsey.com (15) lumenalta.com (16) productiv.com (17) gartner.com (18) gartner.com / ibm.com (19) promethium.com (20) idc.com (via jpmorgan.com) (21) idc.com (22) threadgoldconsulting.com (23) industry surveys (24) experian.com (25) kanerika.com (26) binadox.com (27) mckinsey.com (28) funnel.io (29) crowdflower.com / forbes.com (30) snsinsider.com (31) marketsandmarkets.com (32) tableau.com / vendor pricing (33) vendor pricing comparisons (34) metabase.com (35) snowflake.com / vendor pricing (36) dbt.com (37) industry analysis (38) incident.io (39) snsinsider.com / industry analysis (40) fivetran.com (41) vendor pricing (42) industry analysis (44) cube.dev / vendor pricing (45) microsoft.com / aws.amazon.com (46) hightouch.com (47) vendor pricing (48) hightouch.com (49) vendor pricing / industry analysis (50) industry analysis