Excel Reporting Problems Costing SaaS Companies $42K/Year Per 100 Employees

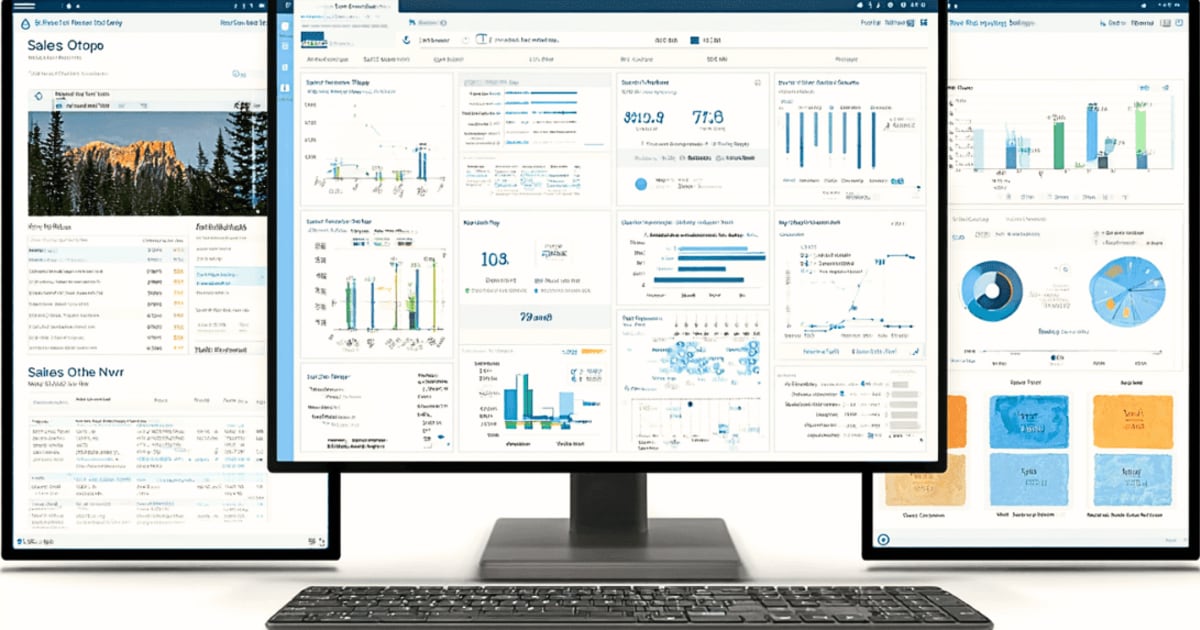
Excel Reporting Problems Costing SaaS Companies $42K/Year Per 100 Employees
Problems with Excel for business reporting cost mid-market SaaS companies $42,000 per year per 100 employees.
That's not a guess. That's what happens when finance teams spend 20-50 hours monthly on manual data entry (1), and 88% of spreadsheets contain errors (2).
Are you wondering why your monthly close takes 10+ days? Why three people have three different versions of the same budget? Why your CFO doesn't trust the numbers anymore?
As we covered in our guide to the 7 critical problems with Excel for business reporting, the root cause is almost always Excel.
Here's what the research shows about problems with Excel for business reporting—and what to do about it.
The Real Cost of Excel-Based Business Reporting Problems
88% of spreadsheets contain errors according to a 2008 meta-analysis of multiple studies (2).
94% of spreadsheets audited in field studies contain errors, based on a weighted average from seven field audits examining 88 operational spreadsheets (3).
90% of Excel spreadsheets with more than 150 rows contain material errors according to KPMG audits (4).
100% of financial models contain errors of some kind according to Ernst & Young research (4).
Cell error rates range from 0.87% to 5.2% depending on how errors are defined, with an average cell error rate of 1.79% across 270,722 formulas audited (5).
Manual data entry generates errors at a rate of 1-4%, with industry averages hovering at 2% for manually entered records (6).
60% of invoice errors originate from manual data entry according to APQC research (7).
80% of companies using Excel for revenue and deferred revenue management have material errors in their reported revenue figures (8).
Time Wasted on Problems with Excel for Business Reporting
Finance teams lose 20-50 hours every month to manual data entry—equivalent to more than a full work week spent copying data from spreadsheets and reconciling accounts (1).
40-60% of analyst time is spent maintaining recurring reports at mid-size SaaS companies, leaving limited capacity for actual analysis (9).
94% of finance teams rely on Excel for month-end close, even when they have ERP systems that could automate most processes (10).
60-70% of financial close time is consumed by data extraction, cleaning, and consolidation in manual Excel-based processes (11).
Cash reconciliation alone takes 20-50 hours per month for finance teams using Excel-based processes (10).
10+ hours per week on repetitive reporting tasks is common among FP&A analysts at mid-market companies (12).
Multi-entity consolidation requires 40 hours monthly for 2 team members as a typical pre-automation baseline (11).
For a 100-employee SaaS company, these activities consume approximately 30 hours monthly per finance FTE. With 2.5 finance employees typical at this scale, that totals 900 annual hours—nearly half an FTE dedicated solely to spreadsheet maintenance (1). We break down the full cost model in the hidden cost of manual reporting.
Financial Losses from Excel Reporting Errors
JP Morgan lost $6.2 billion due to an Excel copy-paste error in their Value-at-Risk model when an employee used a sum instead of an average (13).
TransAlta lost $24 million (10% of annual profit) from a row misalignment error in Excel when bidding on transmission contracts (14).
Kodak suffered an $11 million overstatement from a typo where too many zeros were added to severance pay calculations (15).
Norway's Sovereign Wealth Fund misallocated $92 million due to incorrect data entry in a spreadsheet used for balancing the Government Fund Global (16).
Fidelity Magellan's dividend estimate was off by $2.6 billion when an accountant omitted a minus sign on a $1.3 billion capital loss (13).
West Baraboo, Wisconsin paid $400,000 more in bond interest due to a spreadsheet sum missing one cell in borrowing cost calculations (17). We compiled more of these cautionary tales in real-world reporting disasters that cost companies millions.
Each payroll error costs an average of $291 to correct, including $281 in direct expenses and $10 in internal labor costs (18).
Version Control Problems with Excel-Based Reporting
23% of finance teams face challenges tracking multiple Excel versions across their organization (19) — a pattern we explore in depth in the Excel version control nightmare.
41% have issues identifying and correcting errors in their Excel-based reporting processes (19).
31% have problems finding and gathering necessary data from spreadsheet-based systems (19).
20% deal with broken formulas as a regular impediment to reporting accuracy (19).
19% lack confidence presenting Excel data to non-finance leadership due to concerns about accuracy and version control (19).
Solutions to Problems with Excel for Business Reporting
42% of finance activities can be fully automated right now, yet most companies aren't implementing available solutions (1).
Finance teams using automation complete close processes 50% faster, with some organizations reducing month-end duration from 7 days to under 3 days (20).
Organizations implementing comprehensive automation have reduced financial close cycles by 40-60% while improving data accuracy by up to 90% (21). Our ROI of automated reporting analysis quantifies what these gains mean in dollars.
How to Fix Problems with Excel for Business Reporting
Enhanced Excel Governance Framework
- Cost range: $5,000-$25,000
- Timeline: 4-8 weeks
- Best for: Companies with 50-150 employees where issues are emerging but not critical
- Watch out for: Requires ongoing discipline—doesn't fix fundamental Excel limitations
Excel Add-Ins for Data Connectivity (Coefficient, Power Query)
- Cost range: $99-$199 per user per month
- Timeline: 2-4 weeks
- Best for: Teams needing to eliminate data extraction bottlenecks but want to keep Excel
- Watch out for: Doesn't solve formula errors or version control
Business Intelligence Platform Overlay (Power BI, Tableau)
- Cost range: $20-$70 per user per month
- Timeline: 6-12 weeks
- Best for: Organizations with 200-500 employees where operational reporting consumes significant time
- Watch out for: Requires data modeling expertise and doesn't replace Excel for planning
FP&A Platform (Cube, Datarails, Vena)
- Cost range: $2,000-$10,000 per month
- Timeline: 8-16 weeks
- Best for: Mid-market SaaS ($25M-$150M revenue) with multi-entity structures or audit pressures
- Watch out for: Significant upfront investment and 2-4 month implementation
AI-Powered Report Automation (AgentsForHire)
- Cost range: $1,500/month
- Timeline: 1-3 days for basic setup
- Best for: Sales and RevOps teams spending 1-2 days/week on manual reporting
- Watch out for: Best ROI when you have CRM + database data to connect
Low-Code Workflow Automation (Zapier, Make)
- Cost range: $500-$2,000 per month
- Timeline: 4-8 weeks per workflow
- Best for: Tech-savvy finance teams at 100-200 employee companies
- Watch out for: Can create "shadow IT" governance issues
Robotic Process Automation (UiPath, Automation Anywhere)
- Cost range: $5,000-$15,000 per bot annually
- Timeline: 6-10 weeks per process
- Best for: Organizations with stable, high-volume reporting processes
- Watch out for: Brittle automation that breaks when source systems change
Cloud-Based Consolidation Software (OneStream, BlackLine)
- Cost range: $3,000-$8,000 per month
- Timeline: 12-20 weeks
- Best for: SaaS companies with 10+ entities or regulatory reporting requirements
- Watch out for: Overkill for single-entity organizations
Excel Reporting Mistakes That Cost Companies $$$
Overreliance on manual data entry without validation
- Cost: $34,920 annually to identify and correct errors at 2% error rate on 6,000 transactions
- Fix: Implement data validation on all input cells—one team reduced errors by 93%
Creating single massive files instead of modular architecture
- Cost: $3,600-$7,200 annually in wasted labor troubleshooting file corruption
- Fix: Limit file size to 10-15MB, separate data storage from analysis
Inadequate version control and file naming discipline
- Cost: $1,080-$2,160 annually per finance FTE reconciling version conflicts
- Fix: Standardized naming conventions, cloud storage with version history
Hardcoding values instead of using dynamic references
- Cost: TransAlta's $24 million loss stemmed partially from hardcoded bid prices
- Fix: Create "Assumptions" tab with named ranges for all parameter values
Failing to separate formulas from data entry
- Cost: 5-10 hours per incident tracing overwritten formula errors
- Fix: Lock all formula cells, use distinct color schemes for inputs vs calculations
Neglecting documentation and knowledge transfer
- Cost: $10,000-$25,000 to hire consultants to reverse-engineer undocumented models
- Fix: Create "Documentation" tab in every business-critical workbook
Ignoring Excel's limitations past the scalability threshold
- Cost: $125,000+ annually in excess finance labor at companies past 150-250 employees
- Fix: Honest assessment when total costs exceed $50,000 annually
Problems with Excel for Business Reporting FAQs
Q: How much time do finance teams spend on Excel reporting? A: Finance teams lose 20-50 hours monthly on manual data entry (1). That's 40-60% of analyst time spent maintaining reports instead of analyzing them (9).
Q: What percentage of Excel spreadsheets contain errors? A: 88% of spreadsheets contain errors (2). For spreadsheets with more than 150 rows, KPMG found 90% have material errors (4).
Q: When should we replace Excel with something else? A: The scalability cliff typically hits between 100-250 employees. If your close cycle exceeds 10 days or your total Excel reporting costs exceed $50,000 annually, purpose-built platforms deliver positive ROI within 12-18 months.
Q: What's the ROI of automating Excel-based reporting? A: Organizations implementing automation reduce close cycles by 40-60% and improve data accuracy by up to 90% (21). One company reduced monthly consolidation from 40 hours for 2 team members to 2 hours total (11).
Q: Can we keep Excel for some things while automating others? A: Yes. The hybrid approach—automate data pipelines, preserve Excel for modeling—eliminates 80% of manual work while maintaining analytical flexibility.
Stop Losing Money to Problems with Excel for Business Reporting
The evidence is clear. 88% of spreadsheets have errors. Finance teams waste 20-50 hours monthly on manual data entry. And mid-market SaaS companies lose $42,000 per year per 100 employees to problems with Excel for business reporting.
Want help fixing your reporting automation? Calculate your ROI here
Sources
(1) linkedin.com (2) abacum.io (3) excel-do.com (4) icaew.com (5) mba.tuck.dartmouth.edu (6) orderease.com (7) sensetask.com (8) linkedin.com (9) supaboard.ai (10) ledge.co (11) mammoth.io (12) reddit.com (13) qashqade.com (14) blog.hurree.co (15) planacy.com (16) cfotech.co.uk (17) revelwood.com (18) lano.io (19) thefinanceweekly.com (20) solvexia.com (21) abacum.io